Ph.D. project
description
Linear model for vortex-induced vibrations of slender structures
This
text gives some details on the research that I conducted in
my Ph.D. The general purpose of my work was to show that the
major aspects of VIV for slender structures in both uniform and non uniform flows can be understood and reproduced qualitatively by using the concept of wake oscillator and linear stability. This work was done at both Ecole Polytechnique
in
France in the hydrodynamic laboratory (LadHyX)
under the supervision of prof. Emmanuel
de Langre and at the French Petroleum Institute (IFP). This work was financed by the French Petroleum Institute (IFP). The
results of this research is an interesting model for early design
stage. Its should be use to get insights into the main dynamics of
complex
configurations. Modification on the structure configuration can thus be
made efficiently, the cost of computation being remarkably low. This text summarises quickly some important points concerning my thesis. For more detail, the reader can refer to this pdf containing a paper that we wrote about this subject and that is currently under consideration for publication at the Journal of Fluid Mechanics.
The flow profile behind a fixed cylinder in a uniform cross-flow is unstable past a
certain critical Reynolds number. This instability takes the form of
periodic shedding of vortices that are advected away from the bluff
body (sketched on Figure 1).
|
Figure
1 - Vortex shedding
|
This
alternating vortex
shedding produces periodic pressure fluctuations with predominant
component in the cross-flow direction (Y direction on Fig. 1). The
structure, if
flexible,
undergoes what is commonly called
vortex-induced vibrations (VIV). For velocities in the lock-in range
(lock-in range being the range of velocities for which the shedding
frequency deviates from the Strouhal law and "locks-on" to the cylinder vibration frequency),
the amplitude of vibrations of the
structure can
attain important values, typically
of the order of the
diameter of its cross section.
The high VIV
amplitudes are a
major concern in regards to the service life of offshore structures
that are connecting the seabed to the sea surface, such as risers of
mooring cables (Figure 2). Sustained VIV cause material fatigue
and lock-in phenomena implies a higher drag force on the
structure, causing structure displacements and higher attachment load
at the oil rig.
|
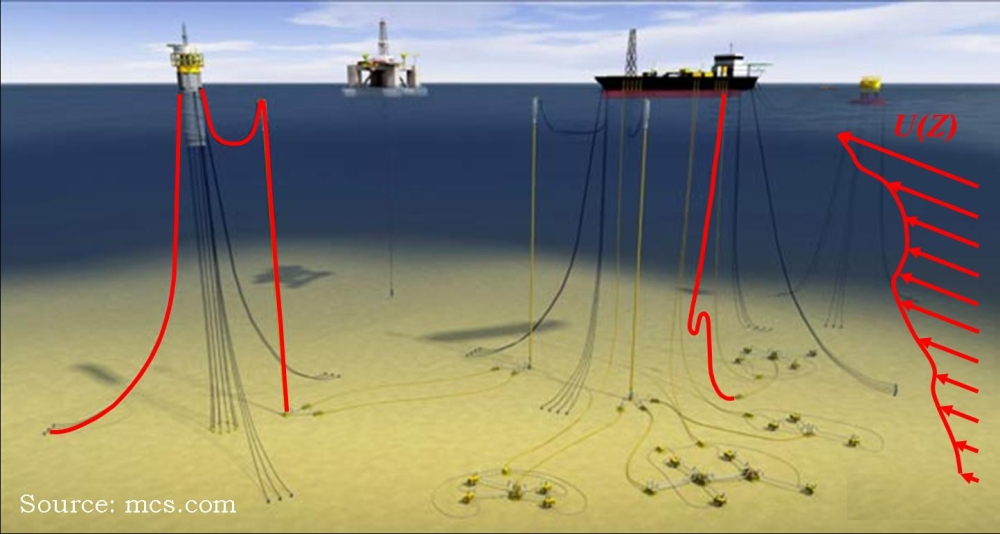
Figure
1 - Risers exposed to complex sea currents.
|
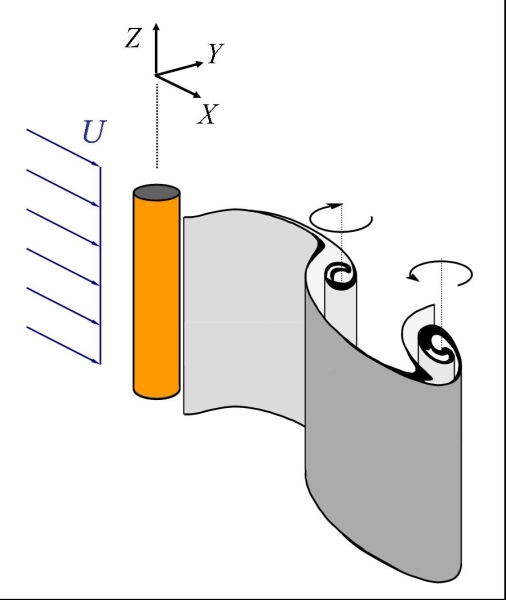
In
my thesis, I have studied a simplified version of a
wake-oscillator model in order to bring some insights to complex VIV
features for slender structures. The basic idea being wake
oscillator models is that part of the wake is modeled using a
mechanical oscillator (usally one that includes non-linearities, such
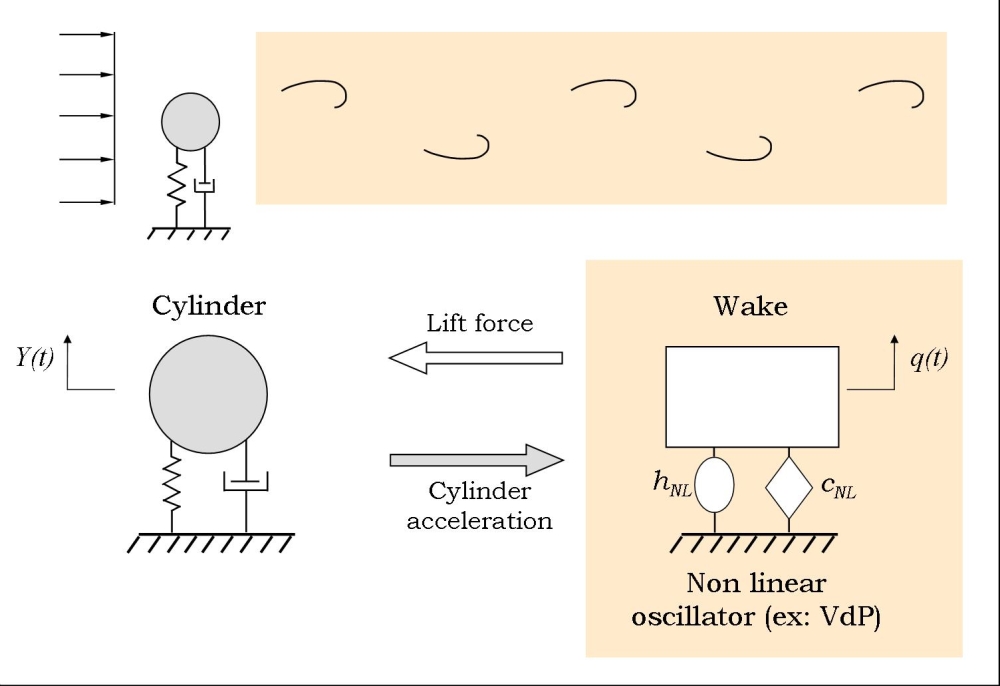
as the van der Pol equation). This is shown on
Figure 3 for an elastically supported rigid cylinder under upcoming
uniform flow. Following Facchinetti et al. 2004, the cylinder
forces the wake by its acceleration.
|
Figure
3 - Wake oscillator principle.
|
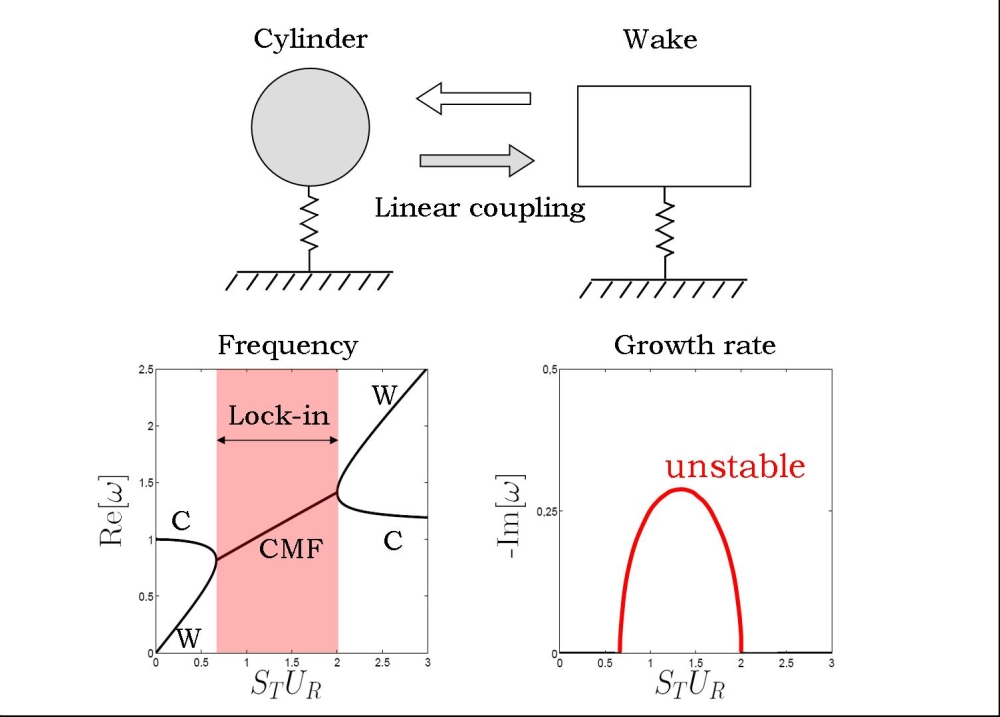
A classical
modal analysis of the simplest form of the model presented above is
done in order to identify the elementary mechanism that allows it to
reproduce VIV physics. In that goal, the nonlinearities are left out. A typical results of such analysis is showed on
Figure
4. It can be seen that for low and high velocities, the
system possess two stable frequencies, one for which the movement of
the cylinder is dominant (noted C) and the other for which the wake
part is dominant (noted W). However, the two frequencies merge for
a
range of flow velocities (noted CMF) leading to a positive growth rate:
the resulting mode amplitude grows exponentially. The main
characteristics of lock-in (beside the amplitudes) can be recover by
this simple analytical development. Lock-in of the wake with the
cylinder can be interpreted as a
linear coupled-mode instability between the wake oscillator and the
cylinder itself. For more detail, see de Langre 2006.
|
Figure
4 - Results of modal analysis as a function of the reduced velocity, frequency (left) and growth rate (right).
|
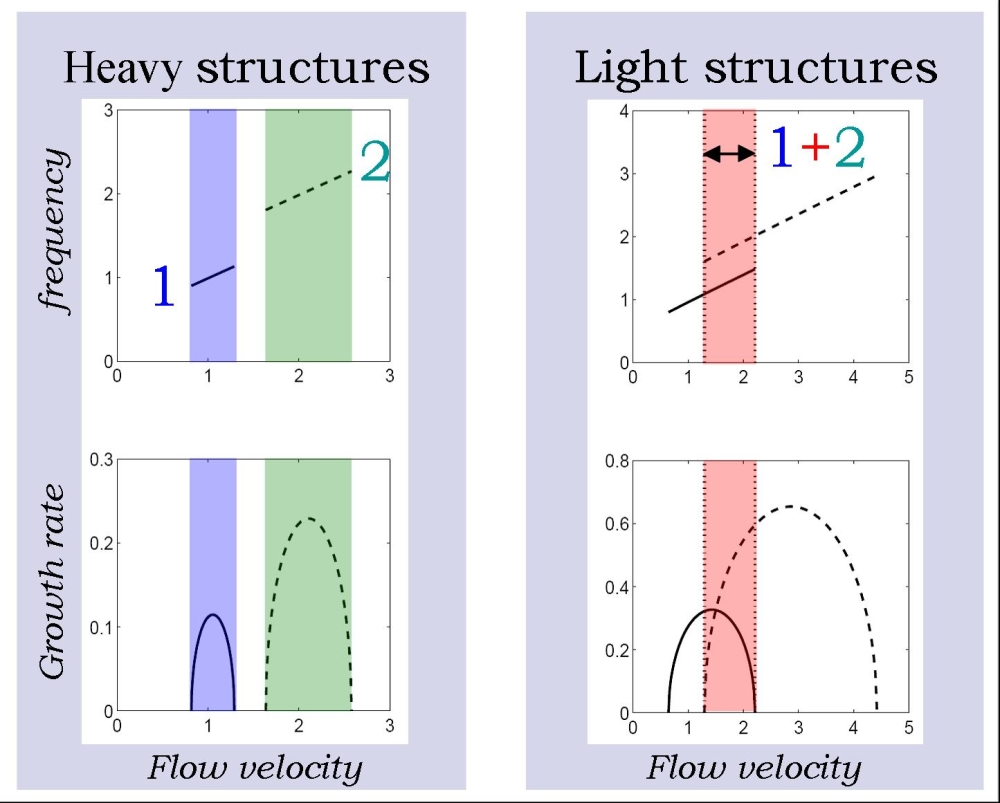
| We have
perform a stability analysis of the same fashion on the case of
flexible structures, such as tension cables or beams subjected to
uniform flow fields. Figure 5 shows, as an example, the evolution of
the frequency and growth rate of the two first modes of a tension cable
for heavy and light structural density (the notion of light and heavy
being here in comparison to the fluid density). The results shown
here (intability ranges, frequency evolution and growth rate evolution)
are obtained by simple analytical calculations. For the light
structure, the theory predicts an overlap of the range of instability
of both mode. This result shows that at a given uniform flow velocity,
more than one frequency is unstable, and thus grows in amplitude
with time. As general results, we have found that a given mode lock-in
range corresponds to the range of velocities where the latter is the most
unstable. Similar linear modes growth rate leads to strong modulation
of the saturated response (phenomenom called mode switching in Chaplin
et al. 2005 and time sharing in Swithenbanks 2007). |
Figure
5 - Frequency (top images) and growth rate (lower images) evolution
with flow velocity for the two first mode of a tension cable in the
case of high structural mass (left figures) and low structural mass
(right figures). Mode 1 in solide line and Mode 2 in dashed line.
|
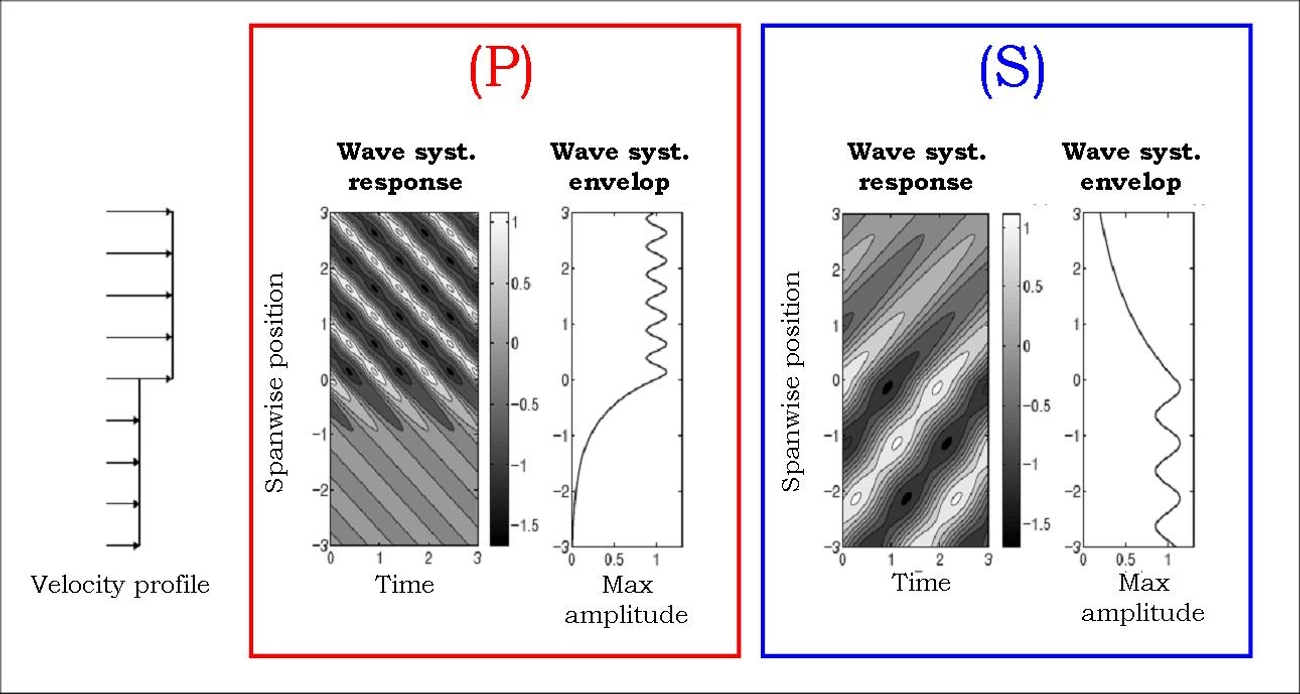
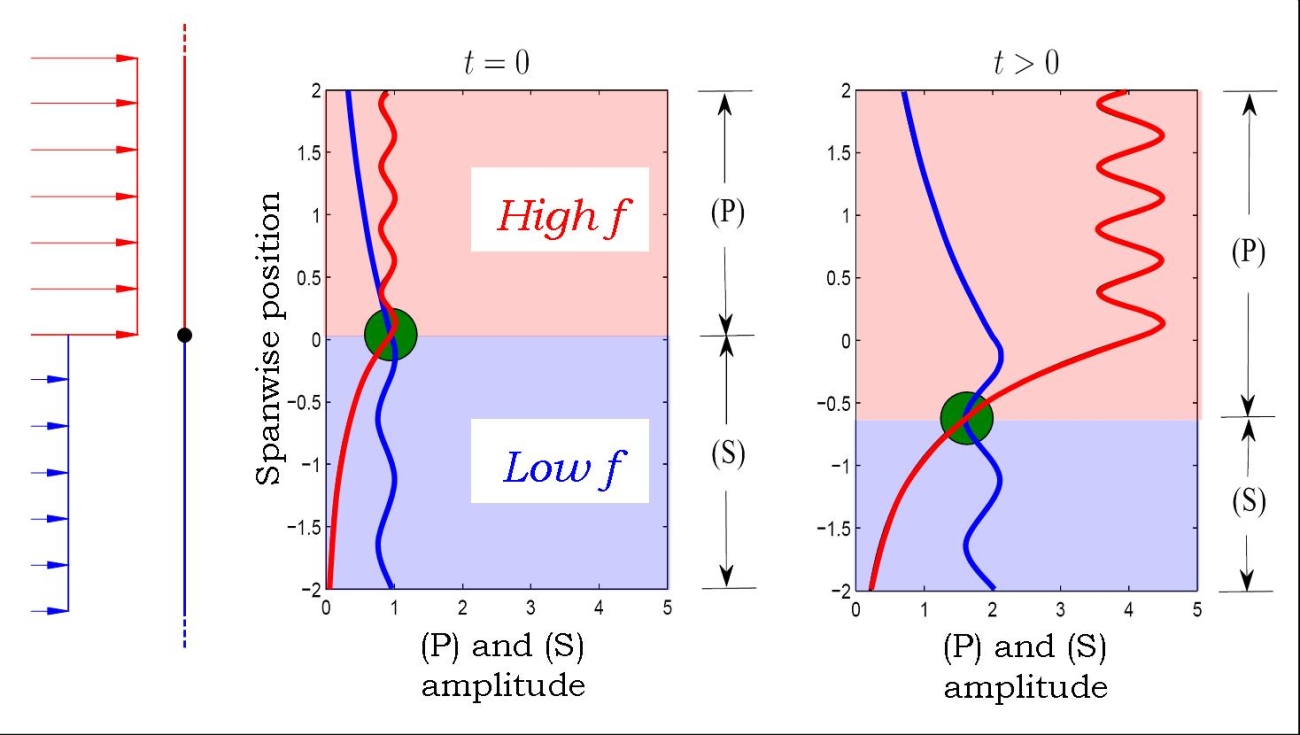
| In non-uniform flows, the generic forms
of response were identified using a simple non-uniform flow
configuration that is composed of an infinite tension cable subjected
to two uniform flow profiles (as shown on Figure 6). Those forms are
called here Primary Wave System (P) and Secondary Wave System
(P). The two forms display similarities concerning their shape: they
are both charaterised by a wave whose amplitude is modulated in space
in one part of the spatial domain and is exponentially decreasing
in the other part. This wave is travelling downward for (P) and upward
for (S). |
| Figure 6 - Generic forms of response for non-uniform flows: Primary Wave System (P) and Secondary Wave System
(S). For (P) and (S), the system response evolution with time and space
(left) and the maximum amplitude envelop (right) are shown. The growth
of amplitude in time has been removed. |
| Two
important characteristics concerning the (P) and (S) systems need to be
identified here. First the frequency of (P) is always greater than
(S). This also results always in smaller wavelength for (P). Second,
the growth rate of (P) is always greater than (S). This results in a
region of high frequency expanding spatially over a low frequency
region when the whole system responses to an initial condition. This is
illustrated in Figure 7. Here, both wave system are given an equal
initial amplitude at t = 0.
The intersection of maximum amplitude is marked here by a green dot.
This dot seperates both high and low frequency regions. As time goes
on, this dot moves downward as the high frequency zone expands over the
low frequency. |
| Figure
7 - Seperation in space of the configuration dominant frequency. As
time goes on, the high frequency domain expand over the low frequency. |
The
linear theory concerning the general form of response in non-uniform
flows has been compared against numerical computation by Lucor et al.
2006. Those authors performed tree-dimensionnal DNS computations of the flow
behind a very slender tensioned beam. In their computations, the
structure forcing on the fluid is taken into account, the movement of
the structure and the wake evolution being coupled. They studied two
flow profiles, Case L and Case E on Figure 8. On the latter figure, a
comparison between the linear theory and the DNS compuration is shown.
For the DNS, the space and time evolution of the beam displacement is
shown. As for the linear theory prediction, the superposition of the
(P) and (S) modes is shown. For Case L, there is a good qualitative
agreement between the DNS and the linear theory prediction concerning
the (P) mode. However, no (S) mode is observed in the DNS. In Case E,
in addition to the waves with high frequency and short wavelength
similar to linear mode (P) that are still found in the DNS, low
frequency waves travelling from bottom to top are found. Those low
frequency waves share some similarities with the linear (S) mode. When
computing the time linear mode (P) takes to overun the entire domain,
we find that this time is much longer for Case E than Case L, providing
some explanation on why a low frequency is persisting for Case E and
not for Case L.
The linear computation is orders of magnitude
lower in computationnal cost than the DNS in this case. Those linear
mode computations take about only a couple of minutes on a standard
office computer. Although the results do not inform us on the
amplitude, the knowledge of the principal dynamical characteristics,
i.e. dominant frequencies, wavelengths, linear growth rates, modes
configuration in space, can help when performing a trial and error
design. Those principal characteristics are quickly obtained by the
method proposed here.
|
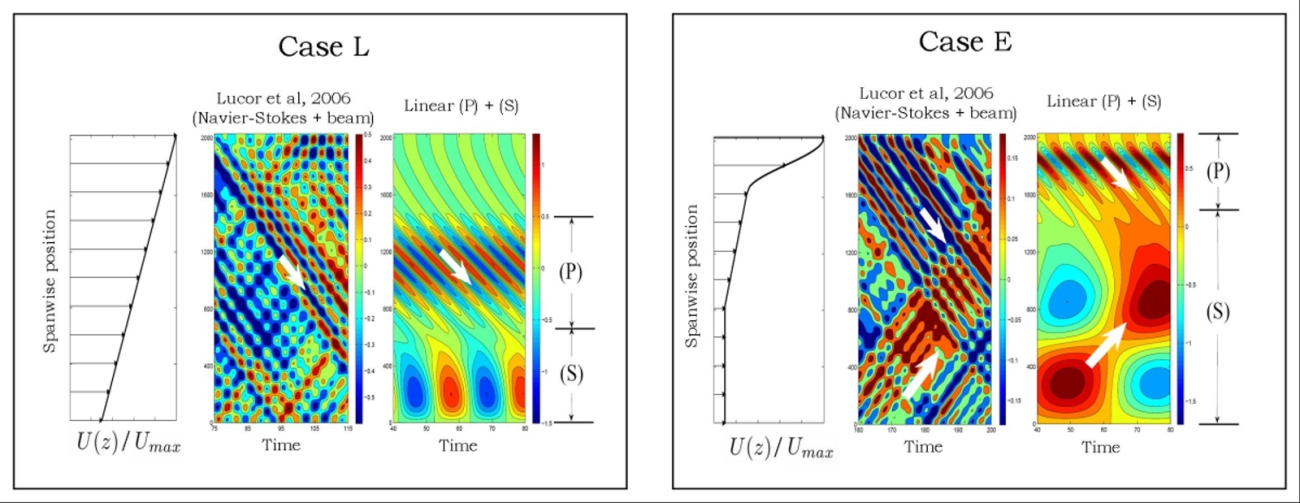
Figure 8 - Comparison between linear theory prediction and DNS computations by Lucor et al. 2006. |
References:
Coupling of structure and wake
oscillators in
vortex-induced vibrations.
Facchinetti M.L., de
Langre
E., Biolley F., Journal of Fluids and Structures,
v. 19, pp.
123-140, 2004
Frequency
Lock-in is caused by a coupled-mode flutter.
de
Langre E., Journal of Fluids and
Structures, v 22, pp.783-791, 2006 Riser modal identification in CFD and full-scale experiments.
Lucor D., Mukundan H. and Tryantafyllou M.S. Journal of Fluids and Structures, 22, pp. 905-917, 2006 Laboratory measurements of vortex-induced vibrations of a vertical tension riser in a stepped current.
Chaplin et al., Journal of Fluid and Structures, 21, pp.3-24, 2005 Dynamics of long flexible cylinders at high-mode number in uniform and sheared flows.
Swithenbanks S.D., Ph.D. thesis, Massachusetts Insta BACK TO R. VIOLETTE WEBPAGE |